Technical Note: Beer Lambert Law for Oxygenation Extraction
The most common approach in the literature for extracting oxygenation from multispectral or hyperspectral images, based on diffuse reflectance spectroscopy, is to use the Beer Lambert law.
Although the model is technically incorrect, it can give results that make sense.
Forward model– the Beer Lambert Law
This is a physics-based law (also used in atmospheric physics, metrology), that comes from summing together infinitesimal absorptions over distance. It describes the resultant intensity of light \(I_T\) after passing through a medium (in transmission), basically saying that a unit increase in absorbance will be amplified exponentially as it continuously interacts with the medium over a distance.
This makes sense, as if there is a constant interaction probability per distance, this will be amplified with a thicker medium.
\[I_T(z) = I_0 \exp\bigg(-\int_0^z\mu_a(z') dz'\bigg)\]To make it useful for us in diffuse reflectance, we assume that
- light is attenuated by tissue according to the Beer lambert law, over an interaction distance $l$
- all non-attenuated light is therefore backscattered and forms part of the diffuse reflectance
- This is equivalent to saying, incorrectly, that so we can directly use Beer Lambert by assuming the transmitted light is the reflected light $I_T = I_R$
- it is super incorrect but it is useful
We can make the assumptions, with non-interacting chromophores, that that the absorption coefficient is a linear combination of chromophores
The integral inside the bracket is the absorbance $a$
\[a(\lambda) = -\ln[I_{R}(\lambda)/I_{0}(\lambda)]=\sum_{i}\varepsilon_i (\lambda) c_{i}l+U\]where
- $a$ is the absorbance (dimensionless)
- absorbers indexed by $i$
- $\mu_a$ is the absorbance [cm-1]
- (mean) path length $l$ [cm],
- $\varepsilon$ is the molar absorption coefficient [L mol-1 cm-1]
- $c$ is the molar concentration [mol L-1]
- $U$ is a wavelength-independent ‘fudge factor’ that captures other losses
Assuming there are two dominant chromophores, oxy and deoxyhaemoglobin, we can proceed with our analysis. This is the molar extinction coefficient of oxy and deoxyhaemoglobin in water, compiled by Scott Prahl (Oregon Institute of Technology). This can be found here.
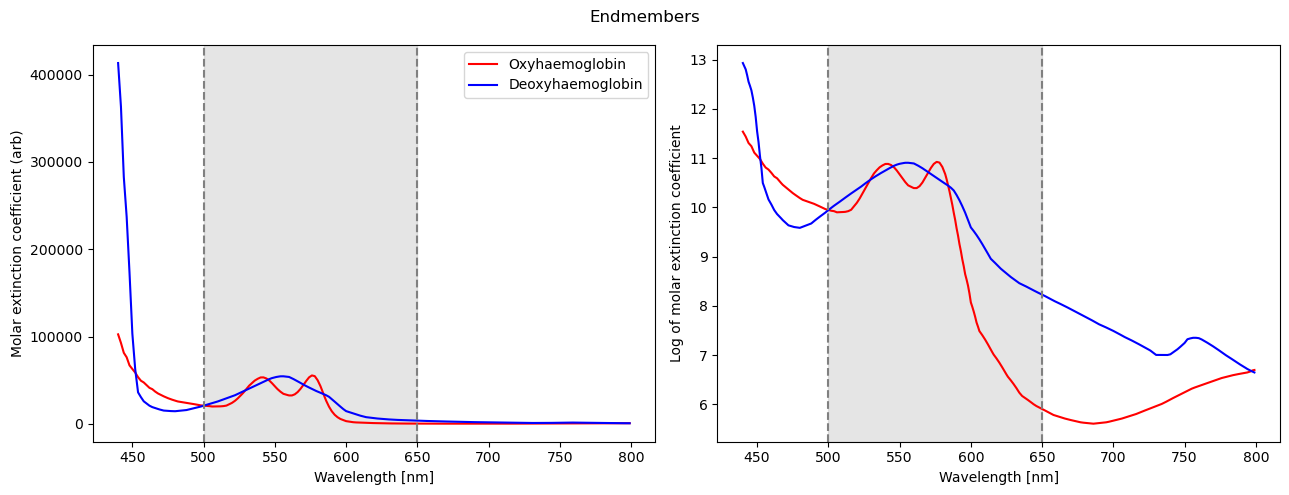
Graphs showing the molar extinction coefficients on a linear and logarithmic scale
Notes
- A high extinction coefficient means that more light is absorbed in that wavelength
- Deoxyhaemoglobin absorbs more in the reds by a (few) orders of magnitude, whilst oxyhaemoglobin absorbs slightly more in the greens
Simulation
We can put this all in a simulation to observe how changing the various parameters changes the resultant reflectance spectrum. We define the oxygenation as the fraction of oxygenated to deoxyhaemoglobin in
\[S_{O_2} = \frac{c_{HbO_2}}{c_{HbO_2 }+c_{HbO }}\]Interactive plot showing the effects of varying different model parameters
Inverse: retrieval
By doing model-based retrieval, we mean to solve for the mixing coefficients (or the concentrations). By using a least squares solver, we obtain a point estimates of the quantities $(c_{HbO_2 }, c_{HbO }, U)$. Unless $l$ is fixed, it is absorbed into the concentrations.
We can observe several potential failure modes of the retrieval algorithm by playing around with the simulation.
- When the path length is high, most of the useful signal is in the wavelengths above 600 nm. Increasing the scattering term has the same effect on the reflectance as reducing the oxygenation saturation.
- Increasing the path length for a high oxygenation sample has the same effects as a reduction in the oxygenation saturation.
References
[1] N. T. Clancy, G. Jones, L. Maier-Hein, D. S. Elson, and D. Stoyanov, ‘Surgical spectral imaging’, Medical Image Analysis, vol. 63, p. 101699, Jul. 2020, doi: 10.1016/j.media.2020.101699.